Google Analytics gives you a clear picture of how visitors find and use your WordPress site. This guide walks through the key terms in your Google Analytics Dashboard, how to read the summary reports right in your WordPress dashboard, and how to find your most popular content using Google Analytics.
Google Analytics Dashboard Terms
Keep tabs on your WordPress site’s traffic using the Google Analytics Dashboard reports. Here are definitions of the commonly used Google Analytics terms:
Avg. Visit Dur.
Time spent by visitor on a web page. Typically, the higher the time on site, the more engaged visitors are in a site’s content.
Bounce Rate
The instances of visitors entering and leaving on the same page. High bounce rates indicate the landing page needs to be improved and SEO work should be considered.
Page Views
Each rendering of the web page by the server is counted as a page view. Page views define an accurate estimate of how many times pages on your site were viewed by visitors.
Visits
The average number of pages viewed per visit to your site. Repeated views of a single page are counted in this number.
Referrers
Websites, Search Engines or Directories or any others identifiable as the origin of the visitor. One thing to keep a pulse on is how many mobile visitors are coming to your site and prepare your action plan for mobile.
Unique Visitors
Is an individual visiting a website over a specified period of time. A visit is understood as two consecutive actions by a visitor within a span of 30 minutes.
% of New Visits
The percentage of visits from first-time visits (from people who had never visited your site before).
Understanding the Google Analytics Summary: Searches, Referrals and Pages
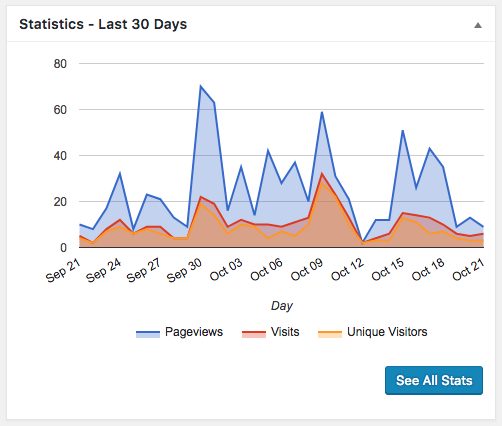
The Google Analytics Summary in your WordPress dashboard provides you with a very high overview of some key performance measurements. You may see some unfamiliar terms (definitions are above), and you will also find information on Pageviews, Referrals, and Search data.
Top Post/Pages
This report outlines the top 5 posts/pages on your site in terms of pageviews. A pageview is counted every time someone views a page on your website. The pages listed here are the top 5 most viewed pages on your site.
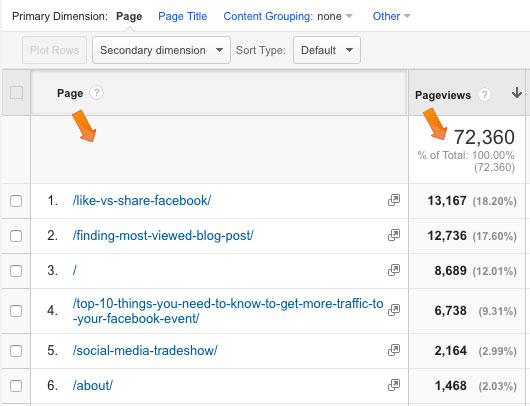
Pro Tip: If you see a backslash (/) that means your homepage.
Top Referrers
This is a list of websites that are sending visitors to your site and how many visitors they have sent to your site.
Top Searches
This list is a little more complicated. In the past, search engines would share the search terms that a searcher used to find your site. For example, if I had gone to Google and searched for “marketing agencies” and clicked on Vivid Image in the search results, Vivid Image would be able to see what I searched for to find them. This is valuable information for marketers. When you know what people searched for to find you, you know you have reached the right target market.
In 2013, Google changed their policy and decided not to let search data pass through to website owners. Now all keyword data that Google would have shared with you falls under (not provided). Bing, Yahoo and other search engines still allow some of that search data to pass through. This means you will see some search terms, but it is not uncommon for (not provided) to take anywhere from 60-90% of that information away.
Find Your Most Popular Post Using Google Analytics
Step 1 is determining what “most popular” means to you. Is it posts that have done well in search over the last year, posts that have gained the most social media traffic, or posts that have been viewed the most?
Determine Your Time Frame
For our “best of” blog we wanted to consider all of the content that was viewed that year. So step one was to change our time frame in Google Analytics, setting the start date to January 1 and the end date to the latest date possible.

View All Pages
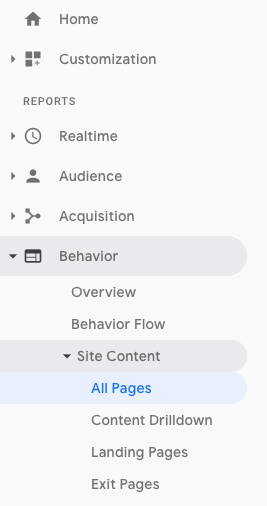
Now you can view what pages on your site received the most page views for the year. To do this, scroll to the Behavior section, then click on Site Content, and finally click on All Pages.
This will generate a report that shows you all of your content and the total amount of pageviews that content has received. A pageview simply means that the page has been loaded by a browser. This is a pretty basic measure of popularity, but it is an easy and quick way to come up with your top posts compilation.
Once you have your report, look through the list of pages and decide which ones you would like to feature. You may have to decide if you want to only feature content that was published in the past year or whatever content was viewed most this year.
Pro Tip
This is also a great opportunity to assess your content. Do you see anything on your list that is really old and irrelevant? Maybe that can be reworked. Do you see something that has really outperformed the rest? Maybe that is the kind of content your audience will crave next. Be sure to use this time and this information to guide your content decisions going forward.