Quick Guide to GA4
Navigating the Google Analytics (GA4) interface can feel unfamiliar and intimidating, especially if you’re just getting started. This quick guide will help you find some of the most useful reports so you can make the most of your analytics data.
We’ll show you how to view some of the most important information our clients care about when evaluating their website’s performance. Since there are multiple ways to look at the same data, we’ll guide you through the easiest way. We’ll focus on the Overview pages, but also show you how to access more details if you want. Feel free to explore on your own and find the way that works best for you.
Note: Keep in mind that the images below are reflective of a demo account, so a few things may look different compared to your own account.
Accessing the GA4 Property
The first thing you’ll want to do when you log into Google Analytics is make sure you’re viewing the correct property. You may have more than one property if you were using the older version of analytics or if you have access to analytics for multiple domains.

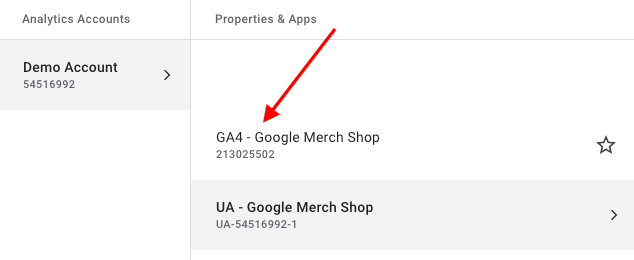
One way to tell that you’re in the right place is by viewing the property title listed next to the Analytics logo in the top left-hand corner. You are in the right spot if it lists “GA4” within the title. If it does not list “GA4”, it’s possible you’re viewing the wrong property.
If you’re not in the right property, simply click that title name listed. This will generate a drop-down list of all the properties that exist within the account.
In the example shown, you can see there are two properties, “GA4 – Google Merch Shop” and “UA – Google Merch Shop”. This shows that there are both GA4 & UA properties available. You can switch between the properties you’re viewing at any time.
Helpful Tip:
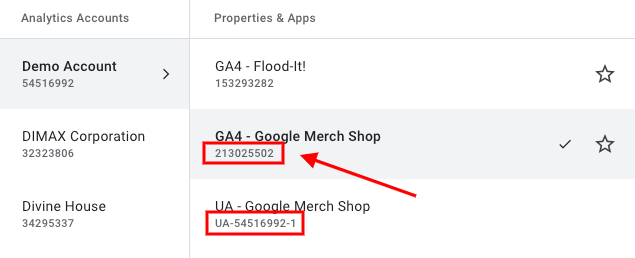
Depending on how analytics was set up, it’s possible your GA4 property does not list “GA4” within the title. If this is the case, you’ll be able to determine the difference by the number listed beneath the property name. If there is a “UA” before the number, then that confirms it is the old UA version. For GA4 you’ll want to access the property with no letters before the number.
Home Dashboard
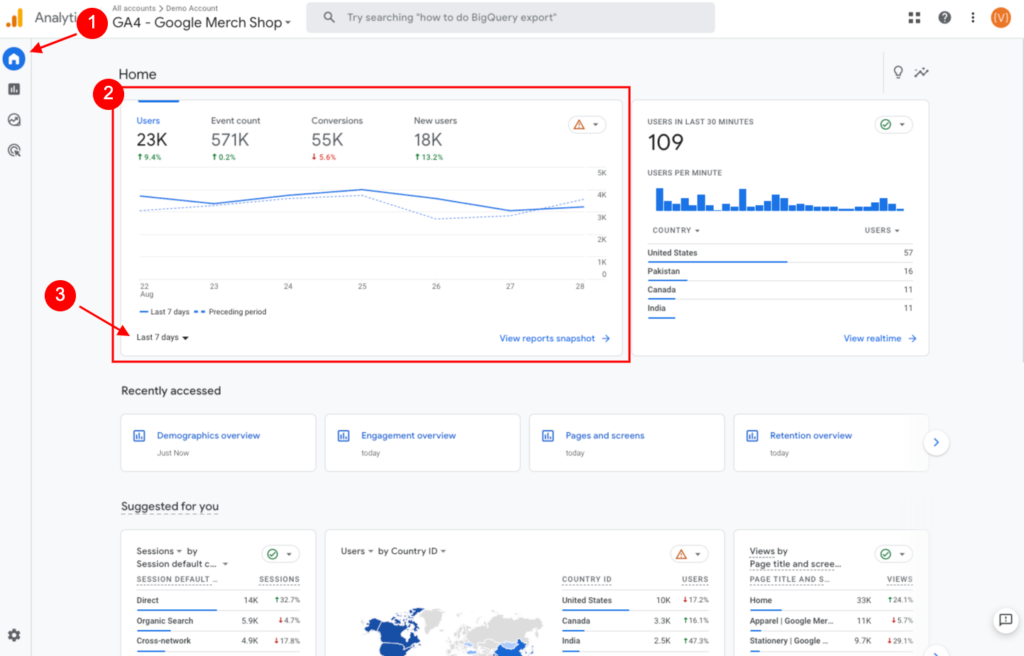
When you first login to Google Analytics, the Home dashboard will be the first screen you see.
This will be the quickest way to get a very high-level overview of recent user activity on your website such as number of Users, Event Count & Conversions. By default it will show you the last 7 days, but you do have the ability to adjust it to any date range. Just click the “Last 7 Days” dropdown and choose the timeframe you’d like to view.
In order to see more detailed metrics, you’ll need to navigate into the Reports section. We’ll be working in this section for each item below.
Helpful Tip:
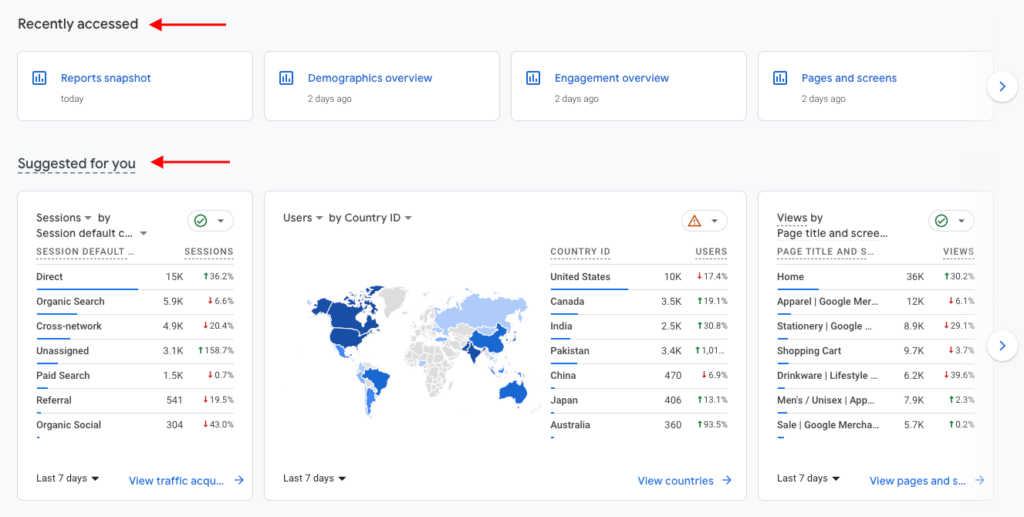
There are two sections titled “Recently accessed” and “Suggested for you“. These will automatically adjust over time based on reports you’ve recently viewed, and what Google suspects you’d like to see based on insights its gathered from your site. The “Recently accessed” section may be especially helpful if you forget how to navigate to a particular report you viewed the previous month.
Top Cities
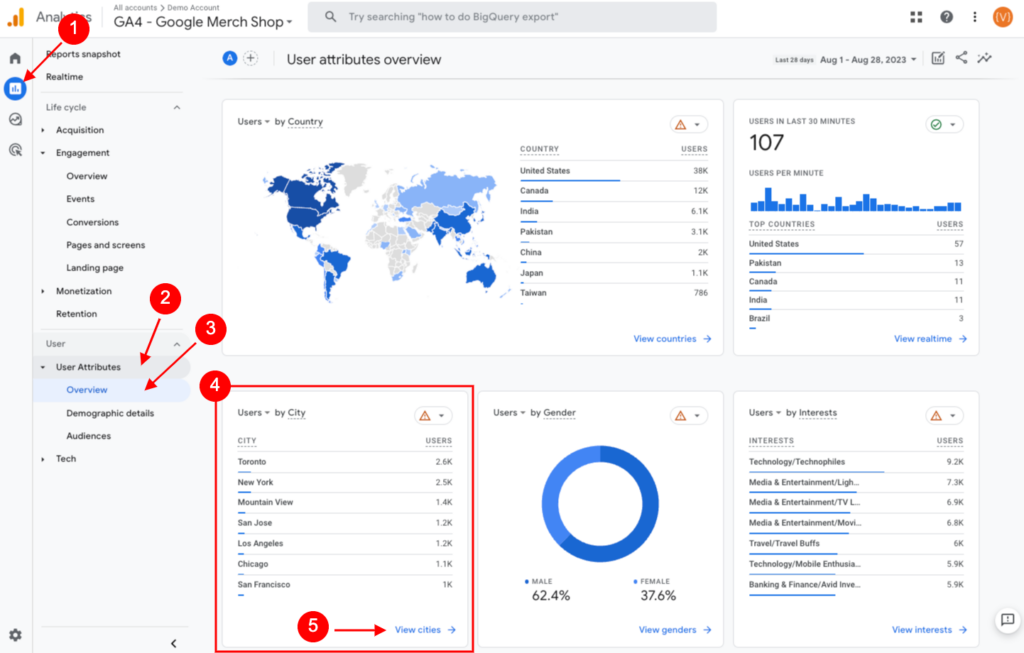
In order to see data on the cities of the users that visit your website, you’ll need to navigate to Reports > User Attributes > Overview > Users by City.
This will allow you to see a brief overview of the users visited by city for the date range you have chosen. If you want to dig in deeper, you can click the “View cities” link at the bottom of that widget which will allow you to see metrics such as New Users, Engagement Rate & Events.
Top Channels
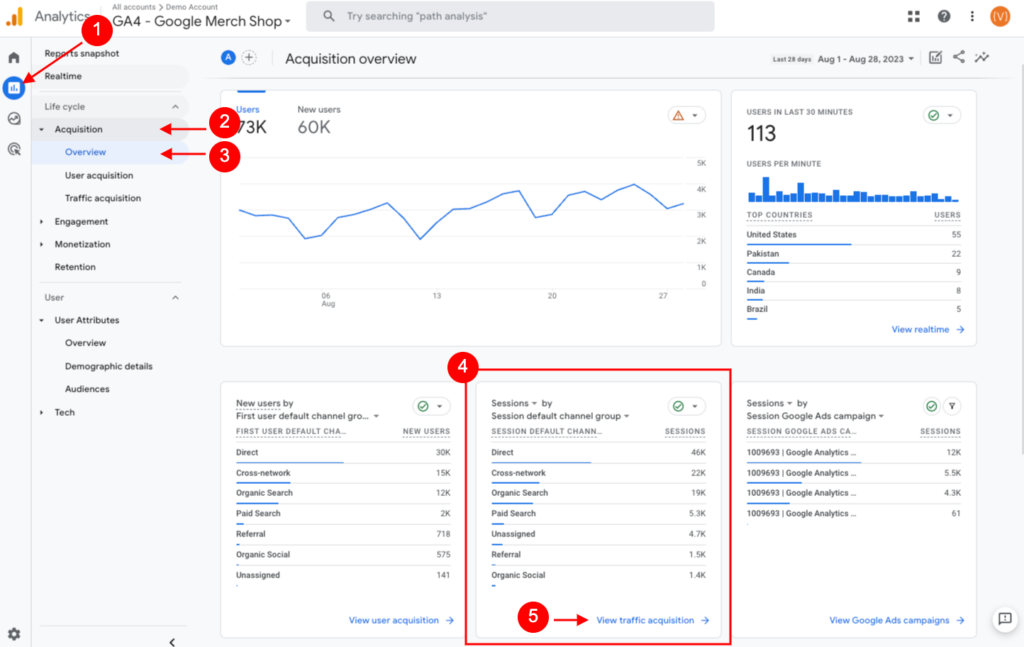
It’s important to know what channels were used to get to your website. If you’re unfamiliar, channels essentially categories indicating how users found your site, such as Direct, Organic Search, Paid Search, Referral, etc.
Navigate to Reports > Acquisition > Overview > Sessions by Session Default Channel Group. By default, you will be able to see the number of Sessions by Channel. To get more details, simply click the “View traffic acquisition” link at the bottom of the widget. This will allow you to see metrics such as Users, Sessions, & Events.
Top Pages
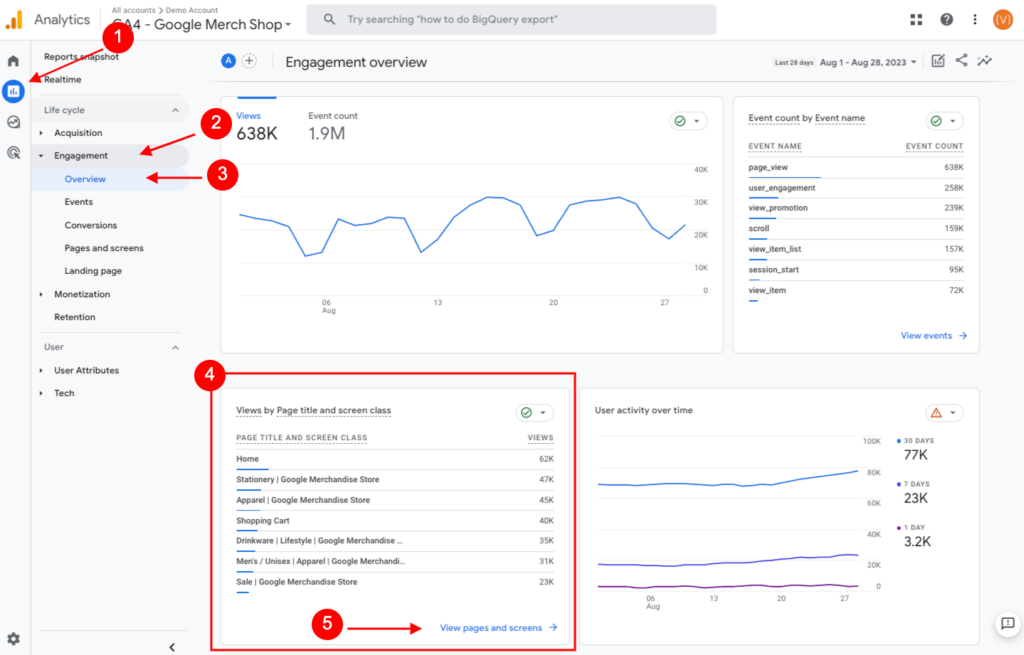
You’ll likely be interested to see the most viewed pages on your website. Navigate to Reports > Engagement > Overview > Views by Page Title and Screen Class.
In order to see a larger list of pages & more details including Users, Engagement Time & Conversions, click the “View pages and screens” link at the bottom of the widget.
Not Finding the Data That You Need?
If you would like further instruction on how to find more in-depth reporting, feel free to reach out to your account director if you’re a client, or get in touch using our online form.
